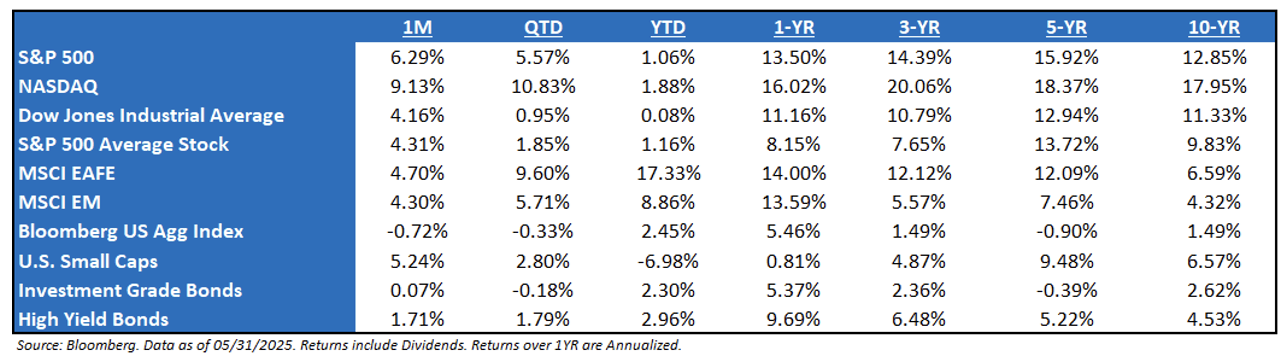
Market Recap – May 2025: To some, it may feel miraculous that the S&P 500 is now positive on the year – which was a new development during the month. March and April should be categorized as having apocalyptic soft data, which is also known as survey data, but this information has simply not transitioned into the hard data, a.k.a. realized statistics. Given this, alongside a very strong earnings season, the market had an unbelievable May. Investors do need to take note that international equities, specifically in EAFE, have outperformed during the market’s downside, but also the upside. With strong equity returns, the market had to look somewhere else for some pessimistic information and that was in the form on longer-dated Treasuries, which took in on the chin due to worries about the U.S. debt load. Overall, a market that is grasping for the earnings impact of tariffs and the yield impact of the Big, Beautiful Bill continues, and likely will continue for several more weeks
Wild Start to the Year – Longer Recap: A narrow rally in the first few weeks, then punishing weakness in February/March (led by Tech) as global allocators moved investments outside the U.S., then “Liberation Day” collapse of all risk assets globally, followed by a rapid recovery led by tech stocks recovering all “Liberation Day” losses, before finally some fear again getting priced into the market as the U.S. debates continue around the “One, Big, Beautiful Bill” and tariffs and de-regulation (Treasury Secretary Bessent’s three-legged stool), making the combined impact on the U.S. government budget and economy incredibly difficult to determine. Equity and bond markets assumed near recession in early April, followed by overheating risk by mid-May. Uncertainty is likely to reign until at least July/August, when 90-day tariff reprieves end and the One Big, Beautiful Bill is signed into law. Meanwhile, hard economic data continues to chug along, and earnings remain resilient.
Long-End Rates Came Back Under the Microscope: With the combination of Moody’s US sovereign downgrade and the passage of President Trump’s “One, Big, Beautiful” bill through the U.S. House of Representatives, long-end rates came back into focus. The market is worried that the bill would increase public debt over the next decade and the ever-so-important debt-to-GDP ratio. Whilst markets in the post-GFC (2009-19) period were defined by monetary policy, since 2020, fiscal policy has been the dominant policy lever. Investors should note that US fiscal spending is up 50% in the COVID era. But U.S. GDP is also about 50% larger (and the stock market has nearly doubled). In fact, the debt-to-GDP ratio today is lower than it was at the end of 2020. Nonetheless, the U.S. fiscal picture remains negative as entitlement spending continues to climb and the U.S. debt servicing cost remains elevated at 18% of tax revenues, exceeding the historical level of 14% when fiscal austerity kicks in.
An Update on the D.C. Administration: Trump is following the opposite order of operations of his first term, when he focused on deregulation and enacting tax cuts before engaging in a modest trade war targeting China. In his second term, he is imposing broad tariffs, including a 10% universal tariff on nearly every country and 25% sectoral tariffs, which raised the odds of a recession and halted business activity before Trump began to walk them back. Congress is moving forward on a tax bill that will provide tax relief for consumers in 2026 and tax cuts for businesses to encourage investment. The House passed its version in late May. Now it moves to the Senate. If the bill is enacted by July 4, before higher tariffs may take effect, that would be a positive and help to sterilize the tariff impact for consumers and businesses. Nevertheless, additional sectoral tariffs remain a risk going forward.
One, Big, Beautiful Bill: With the “One, Big, Beautiful Bill” having passed the House and on its way to the Senate, the market may start looking towards the overall ramifications. Given the interest rate market, it seems like the market is digesting this as if the tax cuts are a bit larger and a bit more front-loaded than expected, and the spending cuts a bit more back-loaded, making the bill more fiscally stimulative in the short-term than expected. Obviously, there is some bickering from both the Right and the Left. From the Right, the primary criticism is that Congress did not further the DOGE mission. This is not an austerity budget, which is what they wanted. On the Left, most of the criticism is the size of the cuts in social spending. There is also some criticism of tax cuts contributing to the deficit, but this is not gaining much traction, probably because almost all of the tax cuts are simply an extension of the current rate, and most people understand a continuation of the status quo is not really making things worse.
Earnings Season Update – Q1 2025: Overall, earnings had a party this past quarter – 78% of companies beat, which is much higher than the historical average. If you remember, heading into this earnings season, the market was pricing in ~8% year-over-year (“YoY”) growth. It came in at 14.0%, led by strong revenues. The critics would say that attention needs to be turning to the second quarter, where the impact of tariffs is expected to play a more significant role. Our thesis for this quarter and (likely) the next few would be that the AI narrative and the capital expenditures (“CapEx”) will continue to drive earnings. While the durability of this trend came under scrutiny at the start of earnings season, the largest companies have shown little indication of scaling back investment. Remember, the Magnificent Seven (“Mag 7”), which are basically tech-proxies and directly tied to the AI-movement, equate to 31.4% of the S&P 500. Said another way, a lot of the contribution to earnings for the S&P 500 seems quite stable.
Politics and Markets: The market is not political. It doesn’t care about draining swamps, political retribution, woke or anti-woke campaigns or DEI initiatives. The market only cares about policies that:
-
- Increase (or decrease) earnings, and
- Support growth (or hinder it).
Any political movement or agenda that is viewed by the market as getting in the way of better earnings and growth will be viewed as negative and be a headwind on risk assets, regardless of whether those policies are from Republicans or Democrats. This is the way we must view political coverage over the next year (and likely four years), and this will help us cut through the noise and stay focused on the policies that will impact markets.
S&P 500 EPS: ’25 (Exp.) EPS = $264.00 (+7.7%). ‘24 EPS = $245.16 (+11.5%). 2023 = $220 (+8.6%). 2022 = $219 (+0.5%). 2021 = $204.*
Valuations: S&P 500 Fwd. P/E (NTM): 21.6x, EAFE: 15.2x, EM: 12. 2x, R1V: 17.1x, and R1G: 27.4x. *
*Source: Bloomberg and FactSet, Data as of 5/31/25
Disclosures
Aptus Capital Advisors, LLC is a Registered Investment Advisor (RIA) registered with the Securities and Exchange Commission and is headquartered in Fairhope, Alabama. Registration does not imply a certain level of skill or training. For more information about our firm, or to receive a copy of our disclosure Form ADV and Privacy Policy call (251) 517-7198 or contact us here. Information presented on this site is for educational purposes only and does not intend to make an offer or solicitation for the sale or purchase of any securities.
This commentary offers generalized research, not personalized investment advice. It is for informational purposes only and does not constitute a complete description of our investment services or performance. Nothing in this commentary should be interpreted to state or imply that past results are an indication of future investment returns. All investments involve risk and unless otherwise stated, are not guaranteed. Be sure to consult with an investment & tax professional before implementing any investment strategy.
Past performance is not indicative of future results. This material is not financial advice or an offer to sell any product. The information contained herein should not be considered a recommendation to purchase or sell any particular security. Forward-looking statements cannot be guaranteed.
The S&P 500® is widely regarded as the best single gauge of large-cap U.S. equities. There is over USD 11.2 trillion indexed or benchmarked to the index, with indexed assets comprising approximately USD 4.6 trillion of this total. The index includes 500 leading companies and covers approximately 80% of available market capitalization.
The Nasdaq Composite Index measures all Nasdaq domestic and international-based common type stocks listed on The Nasdaq Stock Market. To be eligible for inclusion in the Index, the security’s U.S. listing must be exclusively on The Nasdaq Stock Market (unless the security was dually listed on another U.S. market prior to January 1, 2004 and has continuously maintained such listing). The security types eligible for the Index include common stocks, ordinary shares, ADRs, shares of beneficial interest or limited partnership interests and tracking stocks. Security types not included in the Index are closed-end funds, convertible debentures, exchange traded funds, preferred stocks, rights, warrants, units and other derivative securities.
The Dow Jones Industrial Average® (The Dow®), is a price-weighted measure of 30 U.S. blue-chip companies. The index covers all industries except transportation and utilities.
The MSCI EAFE Index is an equity index which captures large and mid-cap representation across 21 Developed Markets countries*around the world, excluding the US and Canada. With 902 constituents, the index covers approximately 85% of the free float-adjusted market capitalization in each country.
The MSCI Emerging Markets Index captures large and mid-cap representation across 26 Emerging Markets (EM) countries*. With 1,387 constituents, the index covers approximately 85% of the free float-adjusted market capitalization in each country.
Investment-grade Bond (or High-grade Bond) are believed to have a lower risk of default and receive higher ratings by the credit rating agencies. These bonds tend to be issued at lower yields than less creditworthy bonds.
Non-investment-grade debt securities (high-yield/junk bonds) may be subject to greater market fluctuations, risk of default or loss of income and principal than higher-rated securities.
Nasdaq-100® includes 100 of the largest domestic and international non-financial companies listed on the Nasdaq Stock Market based on market capitalization.
The Bloomberg Barclays U.S. Aggregate Bond Index is a broad-based benchmark that measures the investment grade, U.S. dollar-denominated, fixed-rate taxable bond market. This includes Treasuries, government-related and corporate securities, mortgage-backed securities, asset-backed securities, and collateralized mortgage-backed securities. ACA-2406-10.